Trends Scores
Overview
The Trends tab in the Content Audiences application displays a Top N list of the highest-performing categories. Each category receives a score represented by up to 5 stars. This page describes the calculation method for these scores.
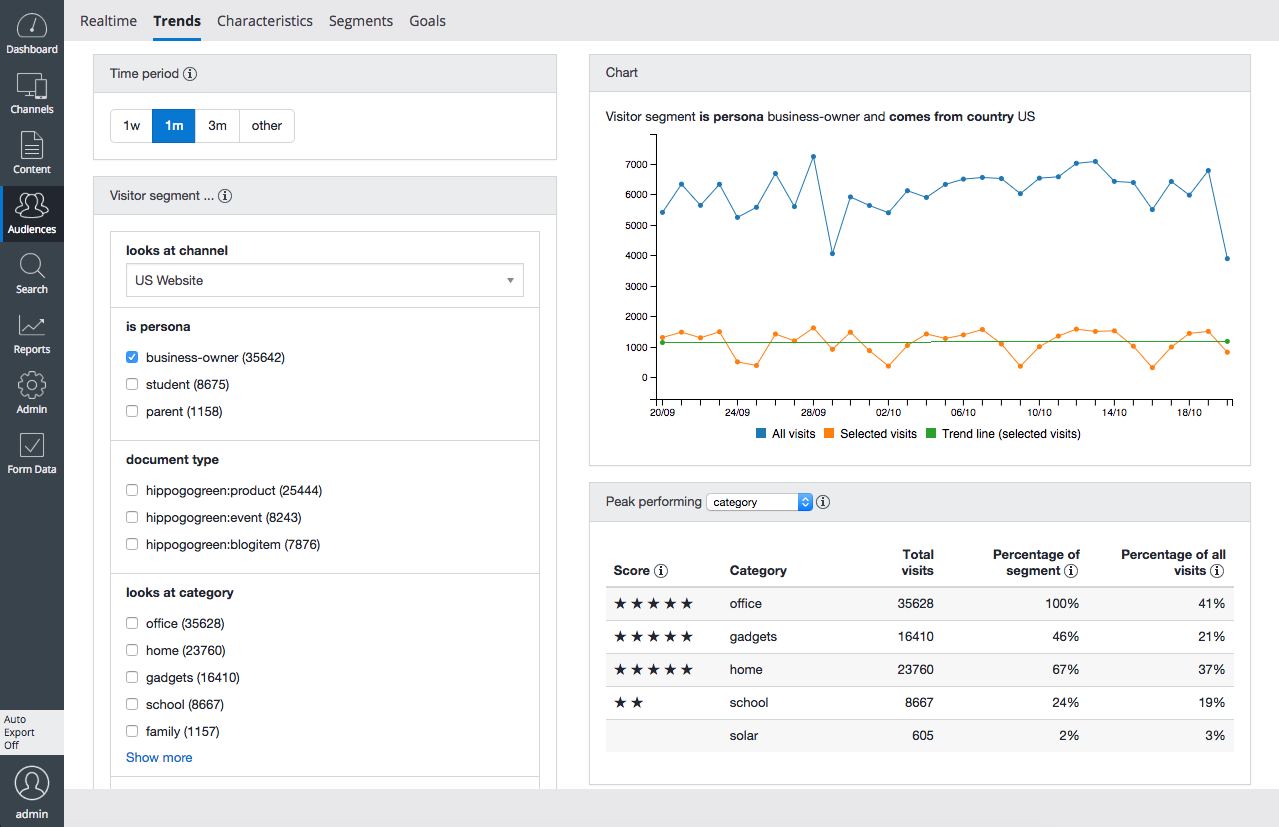
Score Calculation
Each item's star rating is based on its relative frequency in the selected audience compared to the full population.
- Let f (foreground) represent the item's frequency in the selected segment.
For example, in the screenshot, 'energy' has f = 0.38. - Let b (background) represent the item's frequency in the full population.
For example, 'energy' has b = 0.09.
The score s for an item is calculated as:
s = (f - b) * (f / b)
There are two primary ways an item can achieve a high score:
- If an item's frequency increases from a low value (e.g., 4% to 8%), the f / b term has the greatest impact.
- If an item's frequency increases from a higher value (e.g., 50% to 60%), the (f - b) term has the greatest impact.
Scores can be unbounded. To display the score as a star rating, the following formula is used:
stars = floor(6 * s / (|s| + c))
where c = 0.1 (empirically determined).
Note on Terminology
Info:
The term "Score" on this page refers specifically to the calculation described above. This is distinct from the meaning of "score" in the context of scoring and normalization of segment scores.