Trends
Info: The Trends feature in Bloomreach Content requires a standard or premium license. Contact Bloomreach for licensing details.
Introduction
Goal
Identify significant trends in visitor activity across your sites.
Overview
The Trends tab in the Content audiences application provides two main sections. The left column contains filters for time period and visitor segment. The right column displays a graph and a "peak performing" list based on the selected filters.
Filters
Time Period
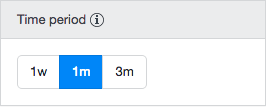
Use the time period filter to select the range for displayed data. Available options are the past 7 days (1w), past 30 days (1m), or past 90 days (3m).
Visitor Segment
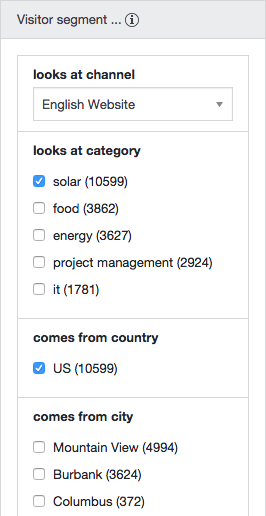
The visitor segment filter allows you to focus on a specific segment of visitors. Data for the selected segment appears alongside data for all visits, enabling direct comparison.
Define a visitor segment by selecting one or more facets, such as "looks at category," "comes from country," or "comes from city." You can select multiple values for a facet when appropriate. For example, visitors may view multiple categories, but each visitor can only come from one country. Selecting multiple countries is not allowed, as it would result in an empty segment.
Graph
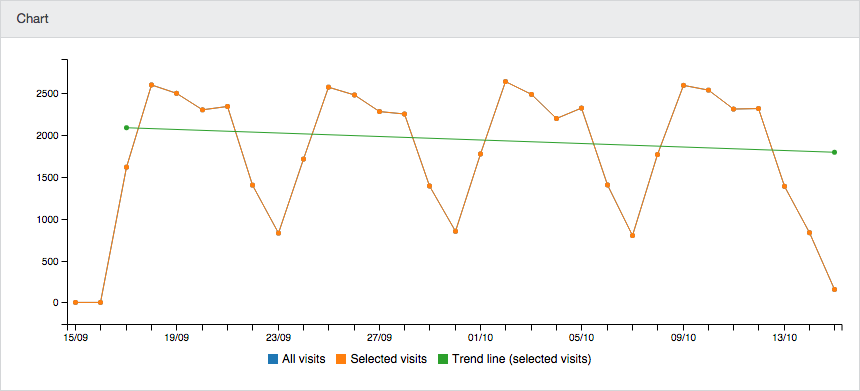
The graph visualizes the number of visits over the selected time period and indicates the overall trend direction.
-
If no visitor segment is selected, the graph displays all visits:
-
If you select a visitor segment, the graph displays both the selected segment and all visits for comparison:
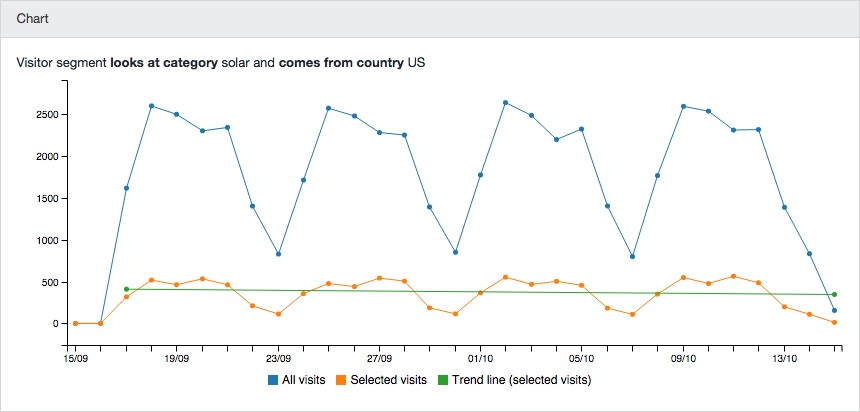
To hide the All visits line, click its legend item.
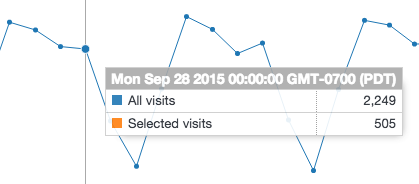
Hover over any data point to view detailed visit counts for that point:
Peak Performing
The Peak Performing list highlights items that stand out for the selected time period and visitor segment.
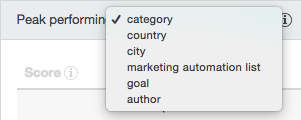
Select a facet above the list to change the dimension, such as "peak performing category" or "peak performing country."
-
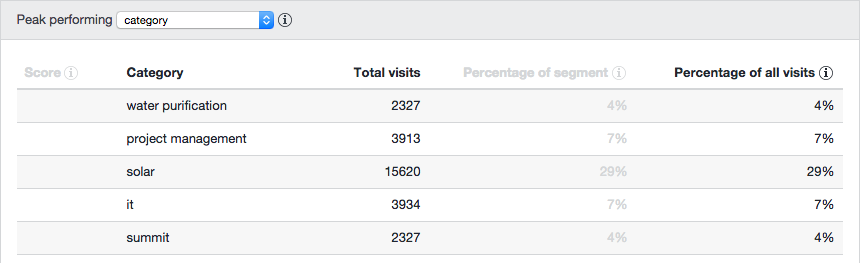
If no visitor segment is selected, the list shows the number of visits and the percentage of all visits for each item:
-
If a visitor segment is selected, the list also displays the percentage of visits from the selected segment and a score from 0 to 5 stars:
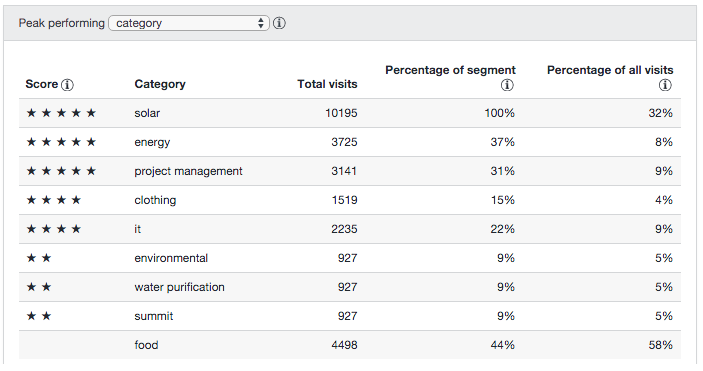
The score indicates how much an item stands out. High scores are assigned when an item accounts for a large share of visits, or when it appears significantly more often in the selected segment than among all visitors. For details on score calculation, see Trends Scores.
Example
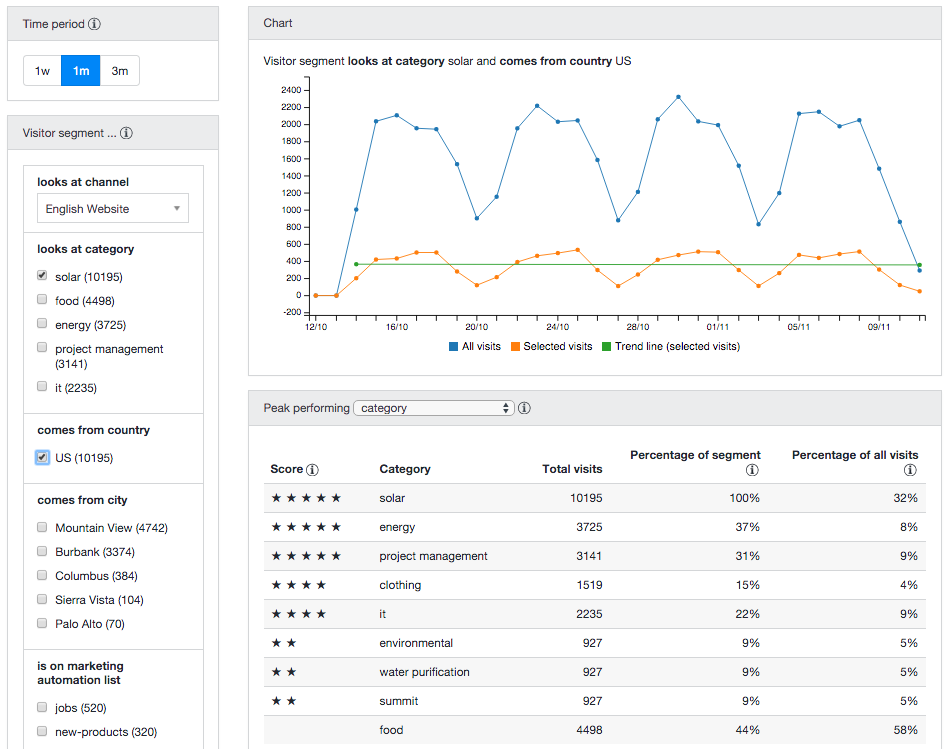
In the screenshot below, the filters select visitors from the US who viewed content labeled 'solar' during the last month:
Key points:
- In the visitor segment filter:
- Under "looks at category," 'solar' is selected, but other categories remain visible and selectable. Visitors may view multiple categories, and you can define segments based on combinations of categories.
- Under "comes from country," 'US' is selected. Only one country can be selected at a time, as each visitor is associated with a single country. Selecting multiple countries is not allowed.
- Under "comes from city," only cities within the selected country ('US' in this example) are available for selection.
- The chart compares visits from the selected segment to all visits.
- In the peak performing list:
- The "category" facet is selected.
- The list ranks categories by their performance within the selected segment.
- Category 'energy' appears in 37% of the selected visits, compared to 8% of all visits. This difference results in a maximum score of 5 stars.
- Category 'food' appears in 44% of the selected visits and 58% of all visits. The small difference results in no stars.
- Category 'solar' is at the top with 100%, as the filter is set to 'solar'.