Monitor an Environment with New Relic
Overview
This guide describes how to monitor a Bloomreach Cloud environment using New Relic as an application performance monitoring (APM) tool.
Info: Bloomreach Cloud uses New Relic in high security mode by default. To disable high security, follow the instructions below.
When to Use
Use this procedure to enable New Relic monitoring for your Bloomreach Cloud environment. Monitoring provides insight into transaction performance, database connections, JVM metrics, and error tracking.
Prerequisites
- Access to a New Relic account with permissions to create API keys.
- Access to your Bloomreach Cloud environment.
- Ability to upload configuration files and deploy distributions in Bloomreach Cloud.
Implementation Steps
- Obtain a New Relic License Key
- Log in to the New Relic dashboard.
- Click your user profile in the bottom-left corner.
- Select API Keys from the menu.
- Click Create a Key.
- Set Key Type to Ingest - License.
- Copy the generated secret key. Do not use the key ID.
- Create a Configuration File
- Create a configuration file containing the following property:
newrelic.config.license_key = YOUR_LICENSE_KEY - If your New Relic license does not support high security mode, add the following line to disable it:
newrelic.config.high_security = false - Example:
newrelic.config.license_key = 425ewrt78sdf
newrelic.config.high_security = false
- Create a configuration file containing the following property:
- Upload the Configuration File
- Upload the configuration file to your Bloomreach Cloud environment.
- Deploy the Distribution
- Deploy your distribution and select the uploaded configuration file to be used as Java system properties.
- Verify Monitoring in New Relic
- Log in to the New Relic dashboard.
- If required, enable high security mode in the New Relic console.
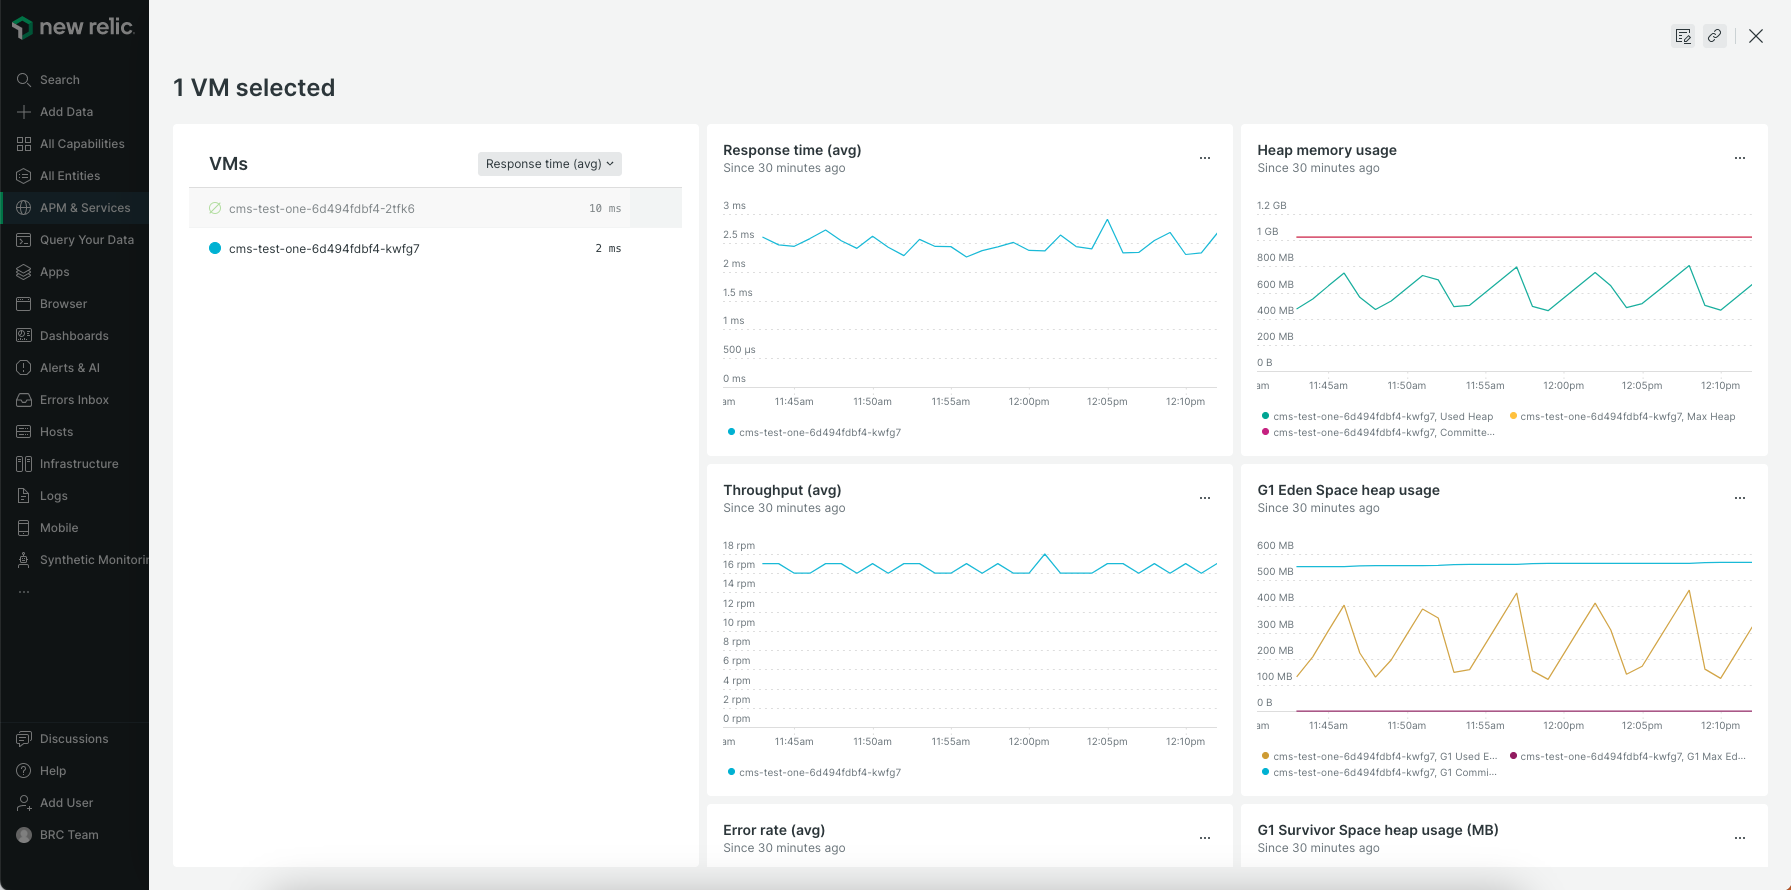
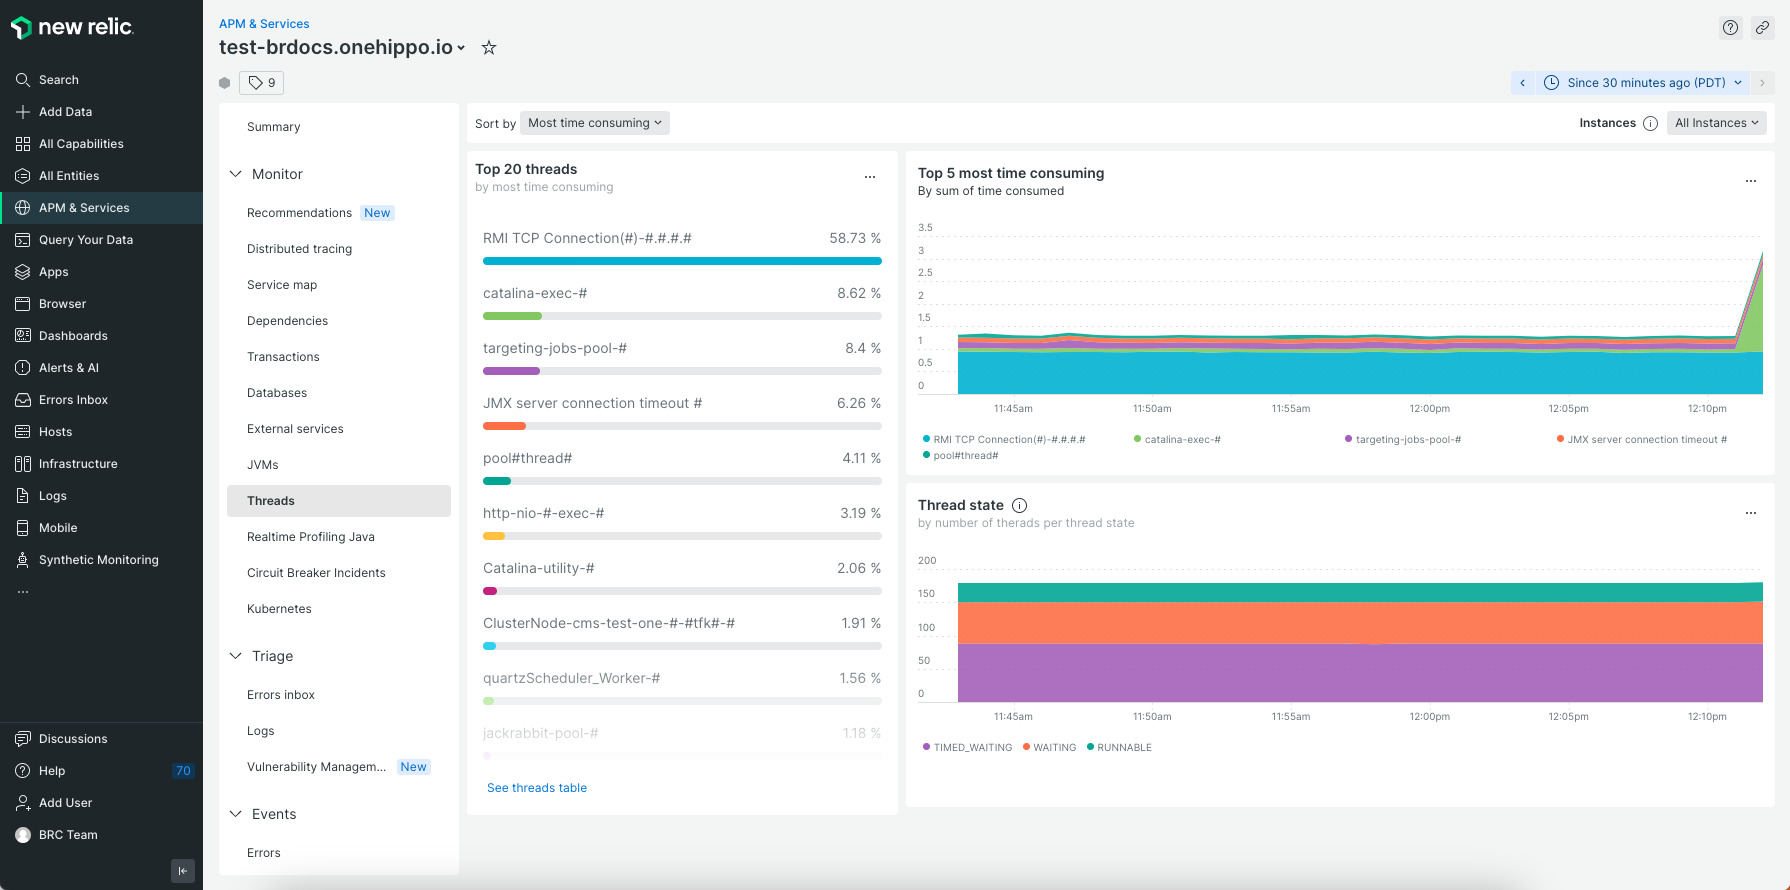
- Confirm that performance metrics, database activity, JVM data, and error tracking are visible for your environment.
Verification
After deployment, verify that your Bloomreach Cloud environment appears in the New Relic dashboard and that metrics are being collected.
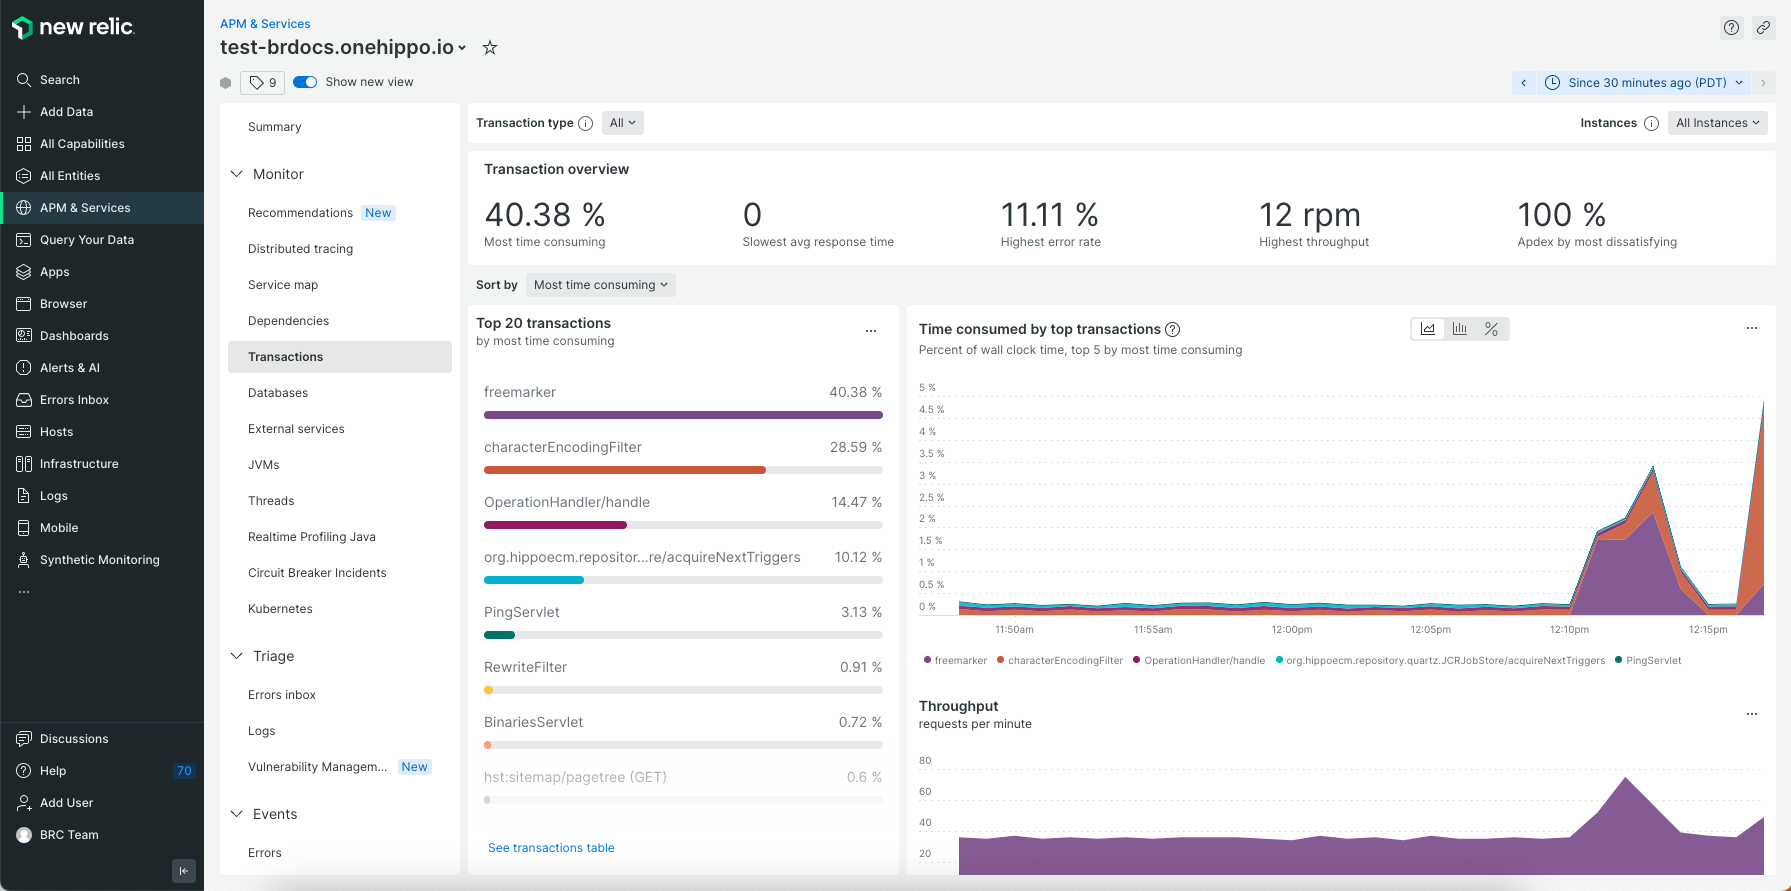
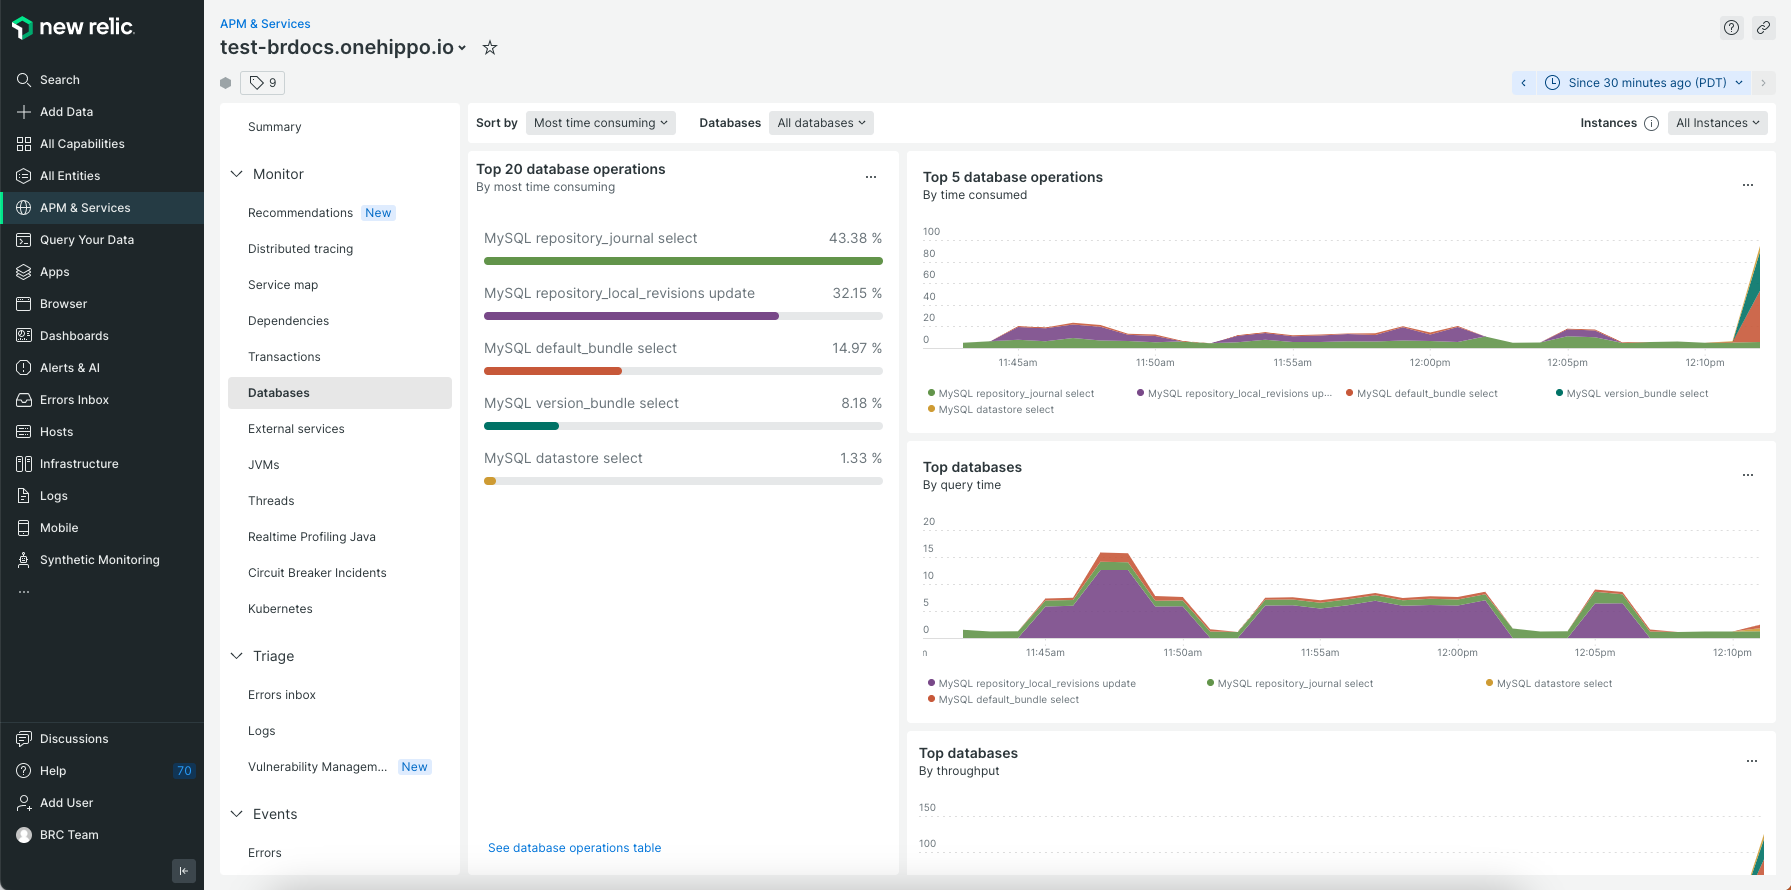
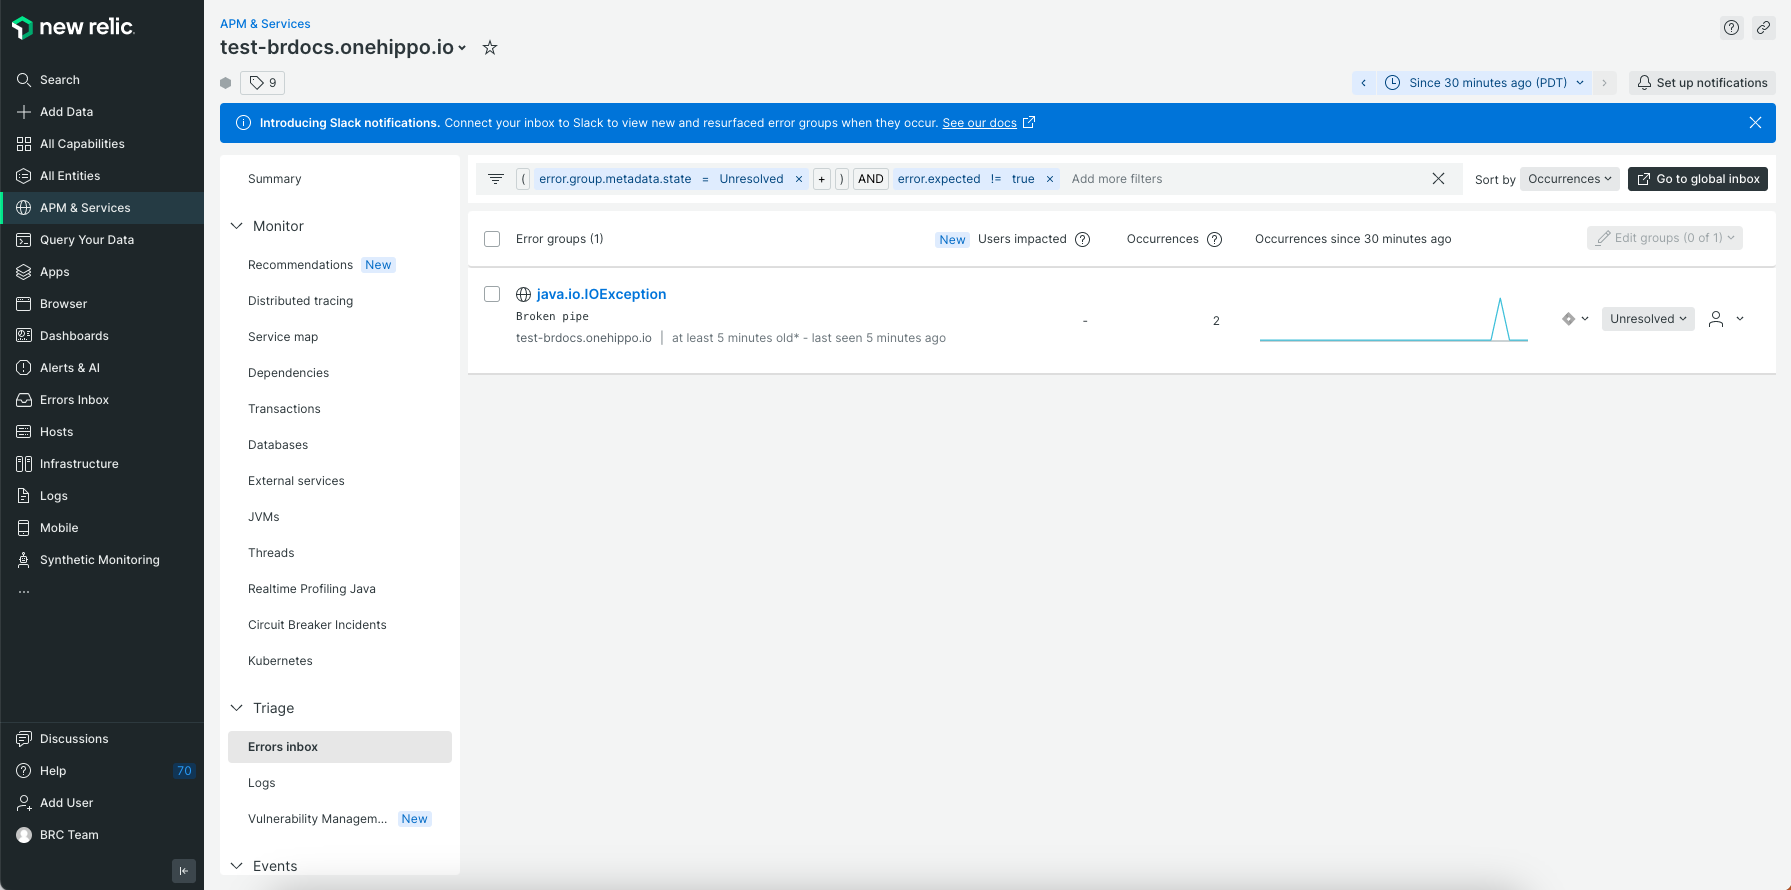
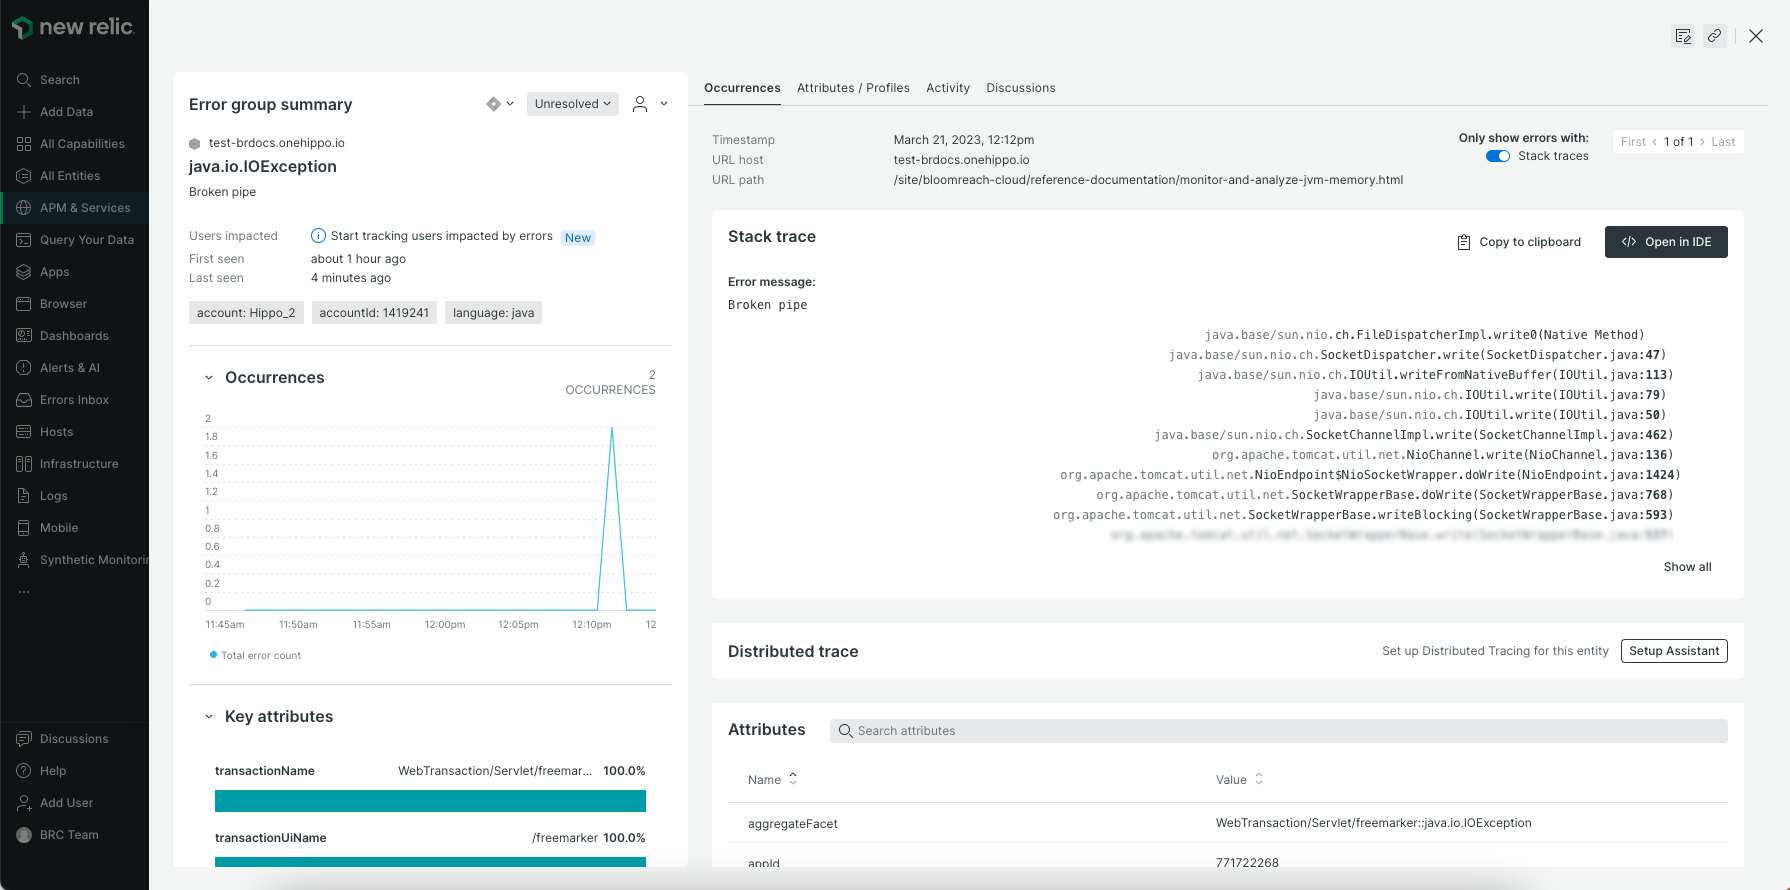
Example Dashboards
The following screenshots show example dashboards and monitoring views in New Relic: