Monitor Application Logs using Humio
Overview
You can use Humio to monitor log files for the CMS and Site applications running in your Bloomreach Cloud environments.
About Humio Integration
Bloomreach Cloud integrates with humio.com to provide access to application logs for the CMS and Site applications in your environments.
This page explains how to access and filter your application logs in Humio. For detailed Humio documentation, visit https://docs.humio.com/.
Note: Humio provides fast search and filtering, with a 60-day log retention period.
Accessing Humio
To access Humio, you must provide Bloomreach with a GitHub or Bitbucket account. Bloomreach will add this account as a user to your Humio repository. If you do not have a GitHub or Bitbucket account, contact the Helpdesk for alternatives.
Although Humio supports Google account authentication, this method is unreliable. Use a GitHub or Bitbucket account for consistent access.
To log in:
- Go to https://cloud.humio.com/.
- Select the appropriate login method (for example,
Log in with GitHub) and enter your credentials.
On your first login, complete the following steps:
- Fill in the profile form.
- Select the free account option.
- Follow or skip the introductory tutorial.
After logging in, you will see two entries under the Repositories and Views tab: your stack and your sandbox.
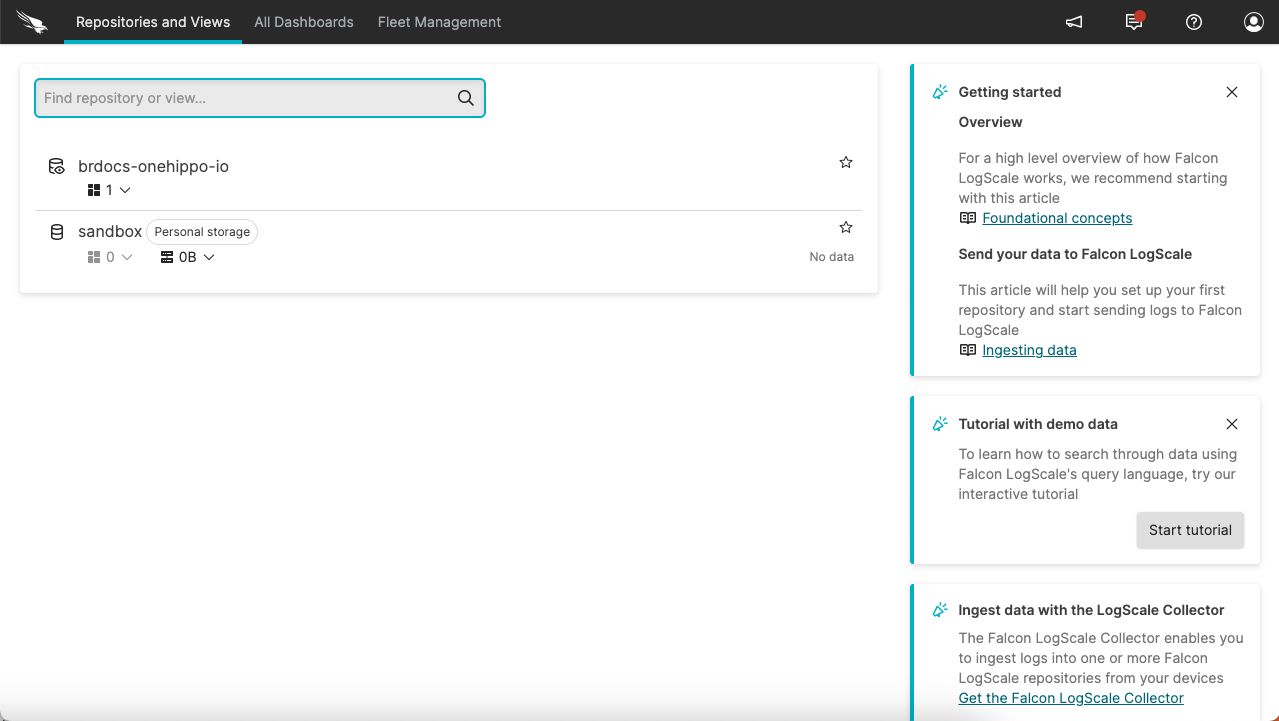
Click your stack name to access log data. Filtering options appear in the bottom left.
User Limit: Each customer can request access for up to two Humio users. If you need additional users, contact your Account Manager. Humio charges Bloomreach based on data ingestion and user count.
Filtering Logs by Environment
Logs from all Bloomreach Cloud environments are collected in the same Humio instance. To focus on logs from a specific environment, create a search filter.
For example, to filter logs for an environment named "blue":
- In the list of fields, select
environment. - Click
Match value in queryfor the value "blue".
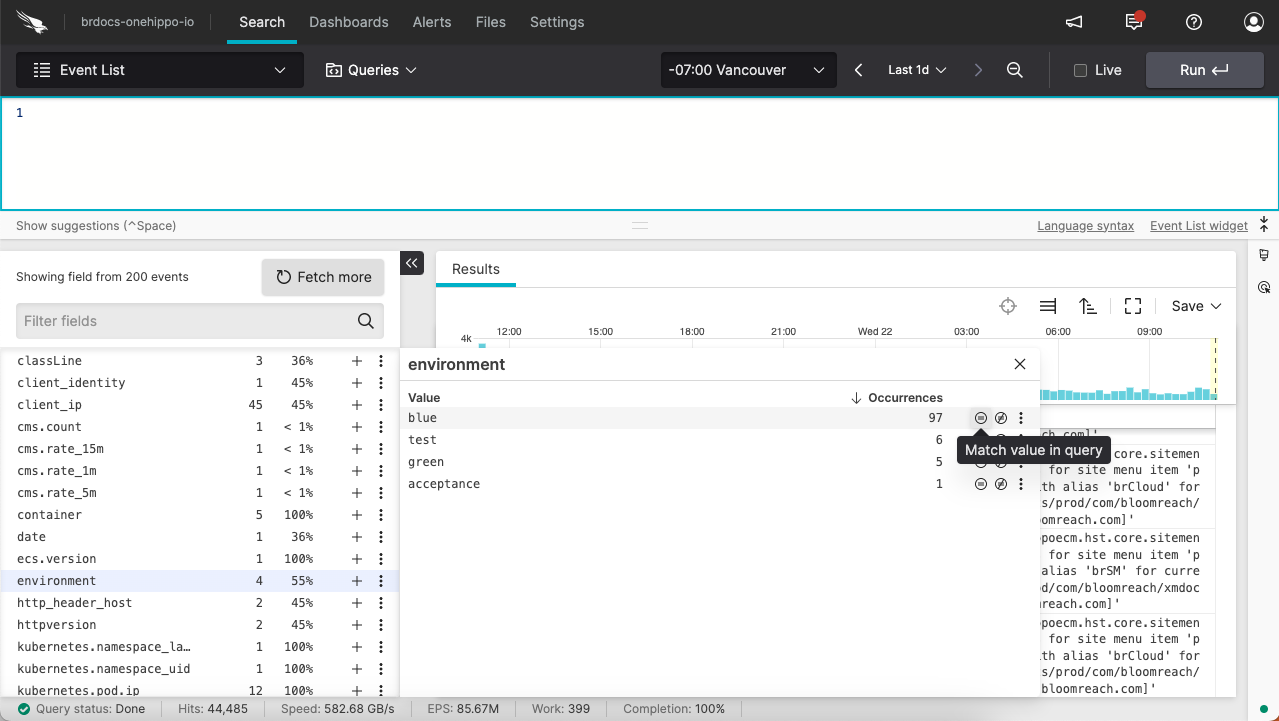
Alternatively, enter the following query in the search box:
environment=blue
Click the Run button to execute the search.
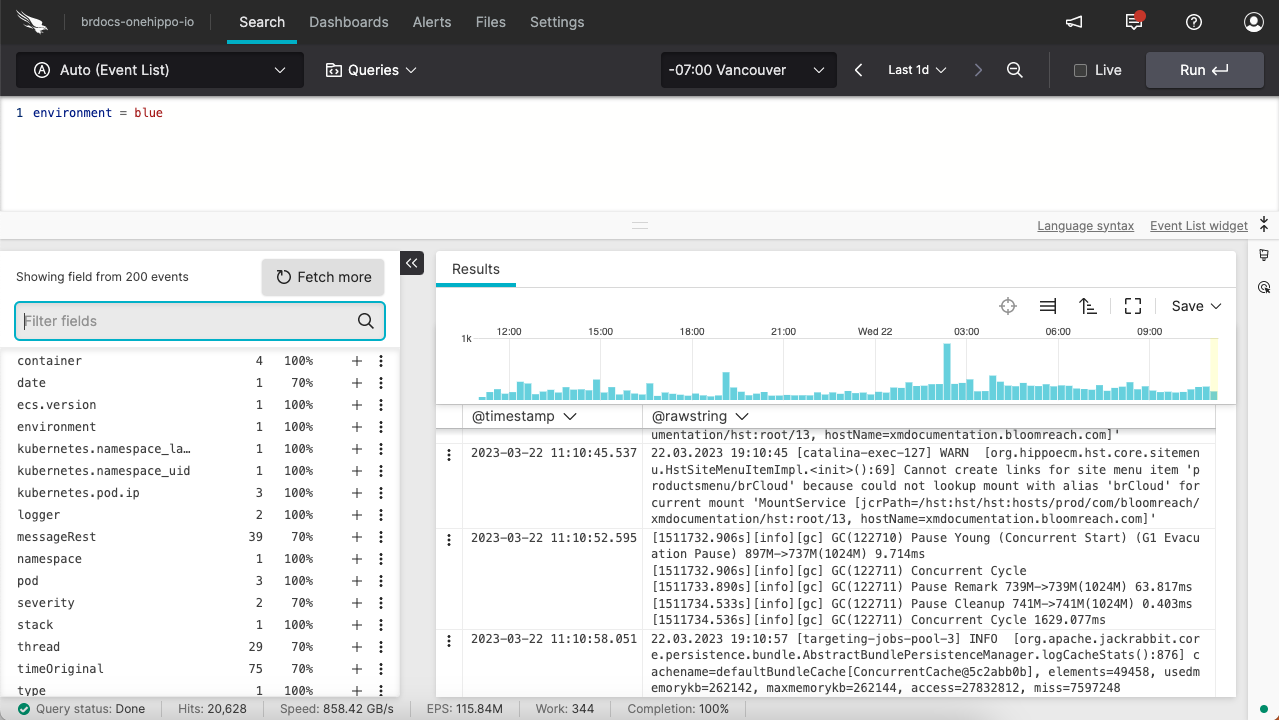
To save this search, open the Save dropdown at the top right of the logs and select Saved Query.
Selecting a Time Range
The current time range is displayed in the top right, defaulting to Last 1d. Click the time range to select a different period. Enable the live-query checkbox to view logs in real time.
Choosing Fields to Display
Each log entry contains multiple fields. Click a row to view its fields. Key fields include:
| Field Name | Description |
|---|---|
class | Java class where the log entry originated. |
container | Log container type: cms-log, site-log, or audit-log. |
environment | Name of the Bloomreach Cloud environment, such as blue or green. |
severity | Log level, such as INFO, WARNING, or ERROR. |
stack | Name of the Bloomreach Cloud stack, for example mycloud.onehippo.io. Relevant if managing multiple stacks. |
Creating Alerts for Your Environments
Humio supports alerting and can notify external systems about errors or specific events. For configuration details, see Automation and Alerts in the Humio documentation.
Bloomreach recommends creating alerts for Out of Memory exceptions. For more information, see Monitor and Analyze JVM Memory.
Additional Humio Resources
For more information on using Humio, refer to the Humio documentation.