Monitor an Experiment
Info: Monitoring experiments in Bloomreach Content requires a standard or premium license. Contact Bloomreach for details.
After you create an experiment, you can track its status and results.
Access the Experiment
- Open the
Experience manager. - Select the channel where the experiment is active.
- Navigate to the page where the experiment runs.
- If page components are not outlined, select the
Show componentsicon in the top right corner.
- Click the component involved in the experiment to open its dialog.
View Experiment Progress
The component dialog includes an Experiment tab. This tab displays real-time data about the experiment:
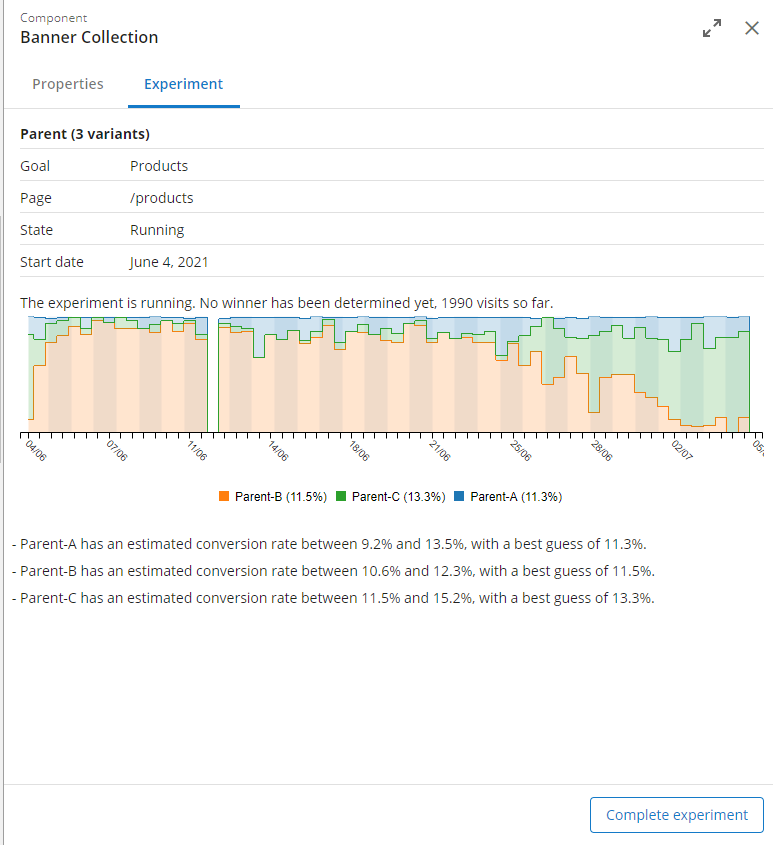
The tab shows:
- Goal name and associated page
- Experiment state (Created, Running, Completed)
- Winner status (if determined)
- Sample size (number of visits)
- A chart visualizing experiment progress
Analyze Experiment Data
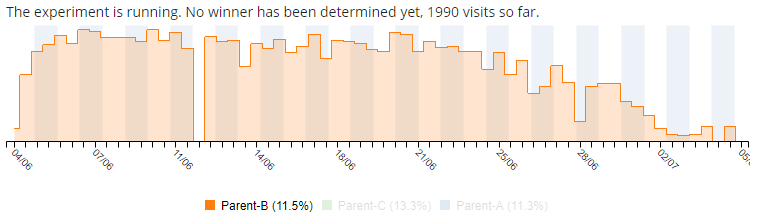
The chart tracks experiment progress over time. For each variant, it displays the percentage of total requests served to visitors.
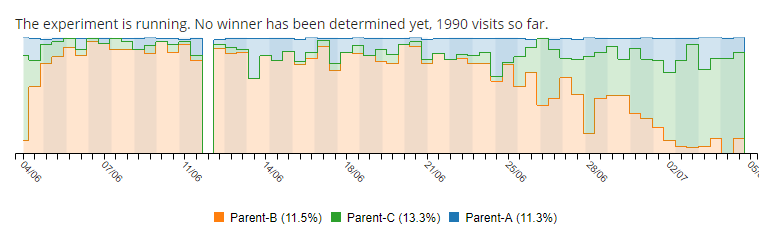
- By default, the chart covers the entire experiment duration.
- Use your mouse scroll wheel to zoom in on a specific time range.
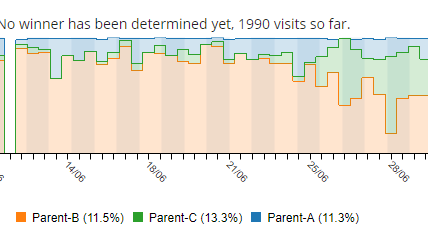
- Hover over the chart to view precise numerical values for each variant.
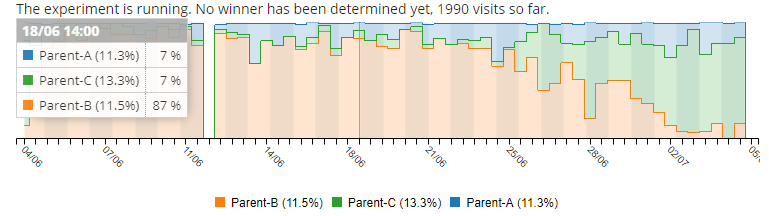
- Hover over variant names in the chart legend to show or hide specific data series.
Determine Experiment Outcome
When the system reaches over 95% confidence that one variant outperforms the others, it marks that variant as the winner. The experiment continues to run until you manually end it.
To complete the experiment:
- Click
Complete Experimentin the component dialog. - Close the dialog.
- Save and publish your changes to stop the experiment.
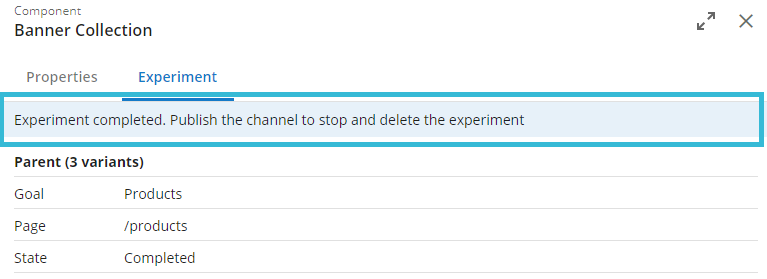
Note: After you complete an experiment, its progress data is no longer available in the
Experience manager.