Audit Addon Dashboard
The Audit Addon Dashboard requires an additional license. Contact your account manager or sales representative for licensing details.
Accessing the Dashboard
You must have the xm.auditaddon.viewer user role to view the Audit Addon Dashboard.
To open the dashboard:
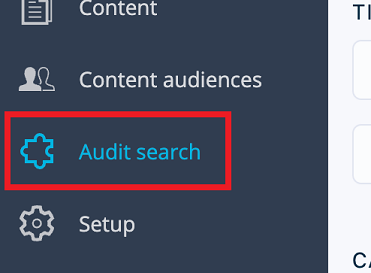
- Select the Audit search tab in the left-hand navigation menu.
- The dashboard displays events only if events have occurred and have been captured since the Audit Addon was enabled.
Dashboard Overview
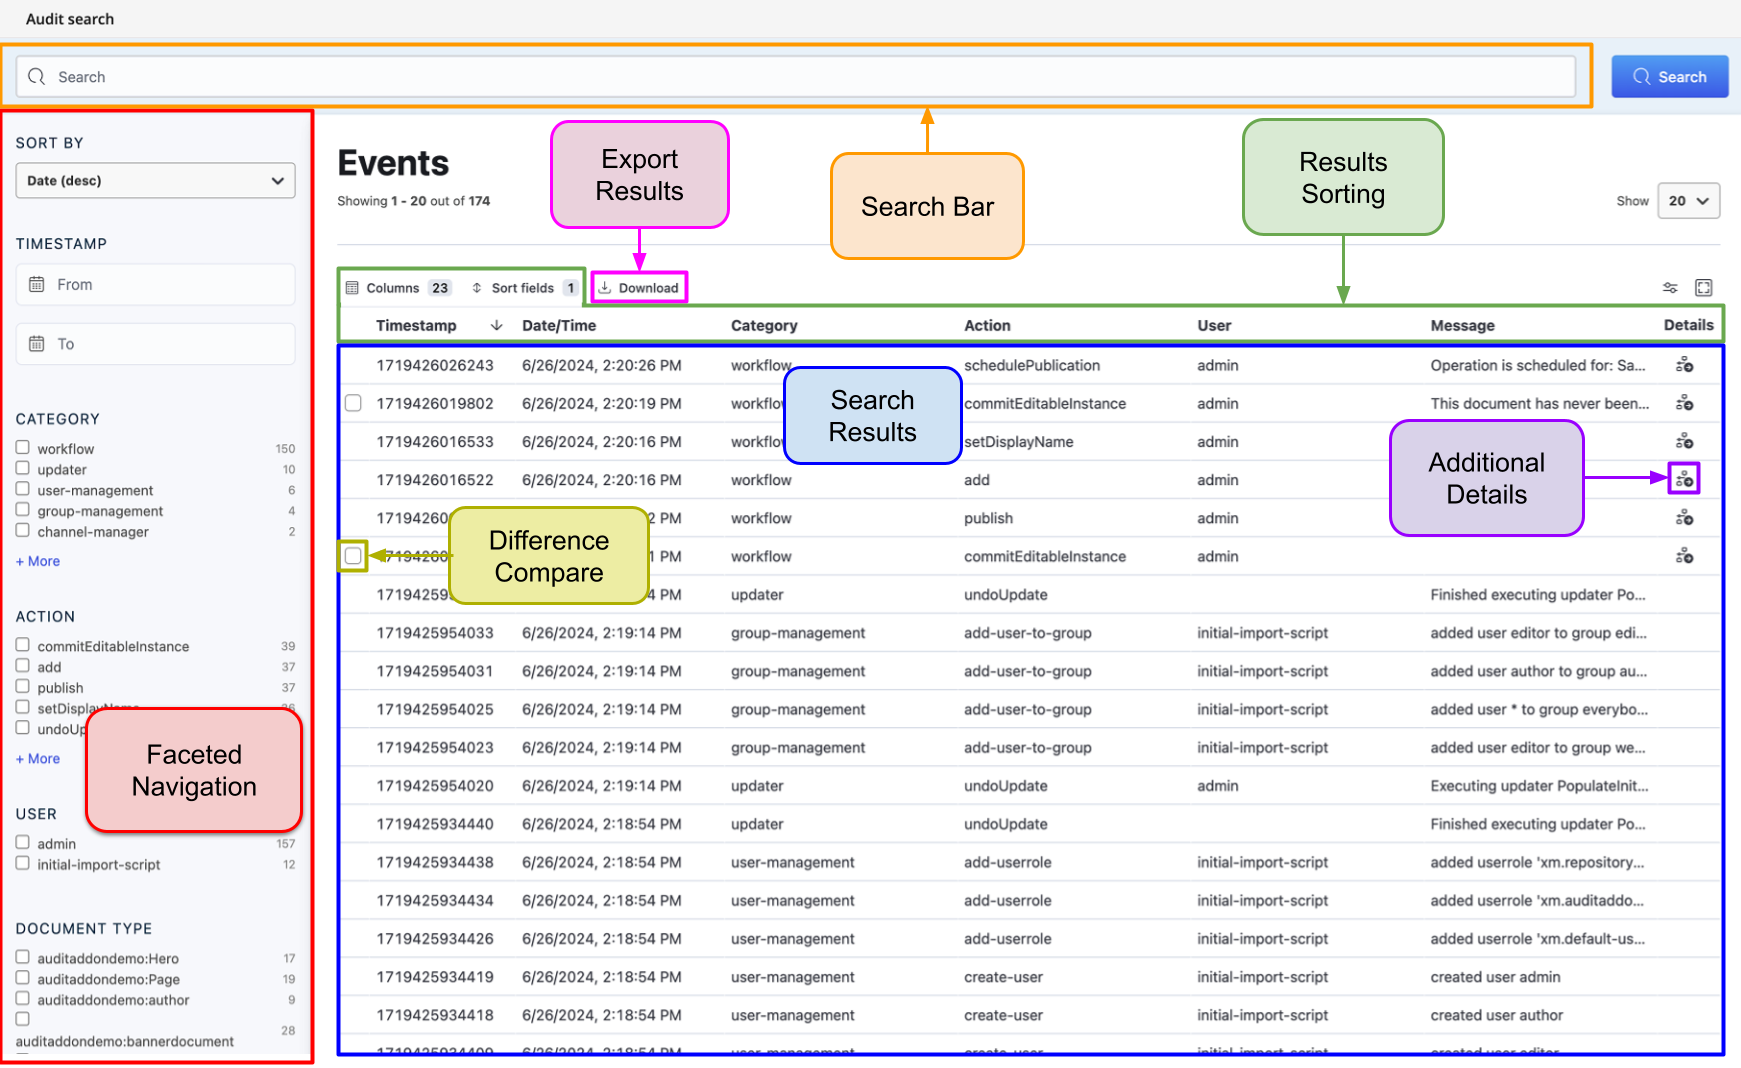
By default, the dashboard lists the most recent events first, sorted by timestamp (newest to oldest). You can change the sort order by clicking a column header.
Faceted Search
Use the faceted search controls on the left side of the dashboard to filter the current set of search results.
Available facet attributes:
- Timestamp
- Category
- Action
- User
- Document Type
- Document Directory
- Document Creation Date
- Document Last Modified Date
- Document Publication Date
- Scheduled Publication Date
Text Search
You can combine faceted search with text search. Use the text search field at the top of the dashboard to search all events in the current result set.
For example, searching for a content document's unique ID returns all workflow events related to that document.
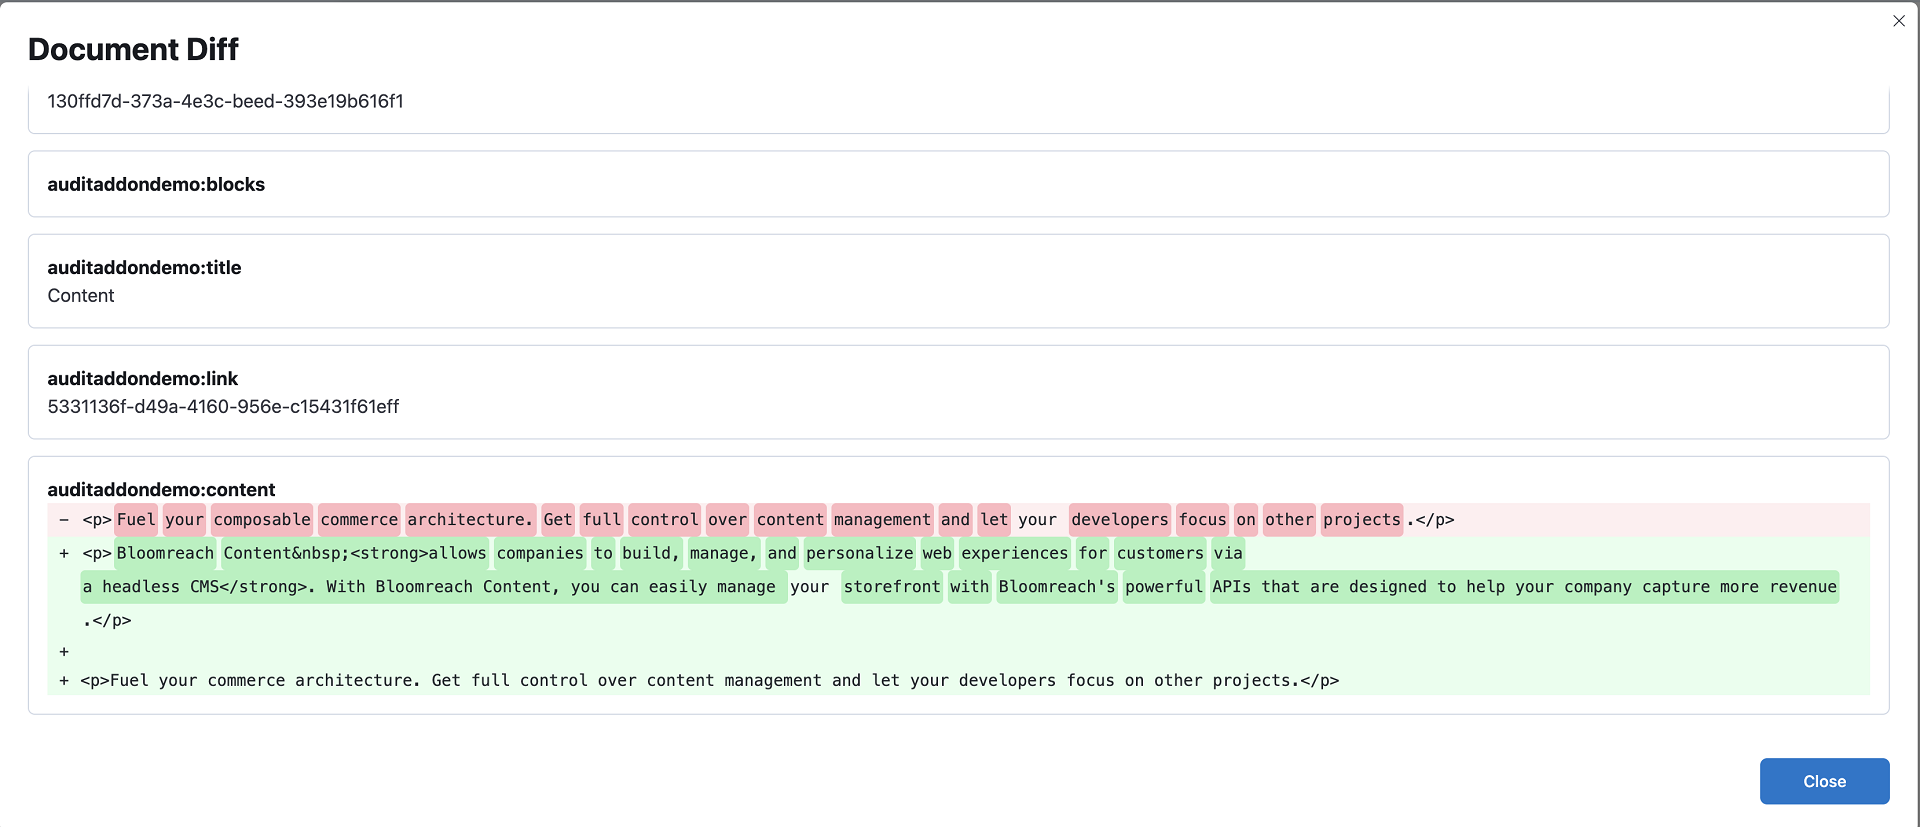
Comparing Document Versions
You can compare the state of a content document between two events:
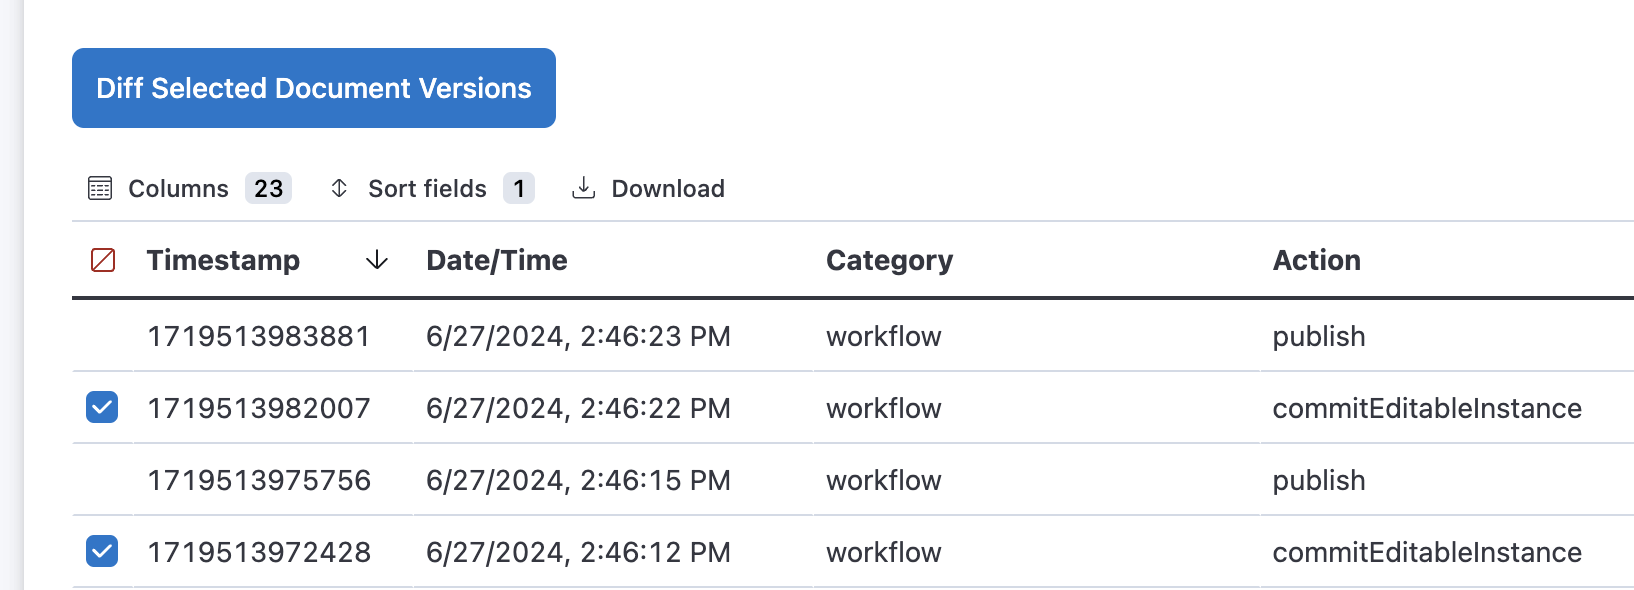
- Select two events related to the same document (for example, two
commitEditableInstanceevents). - Click Diff Selected Document Versions.
The dashboard displays the differences between the two document versions.
Viewing Additional Event Details
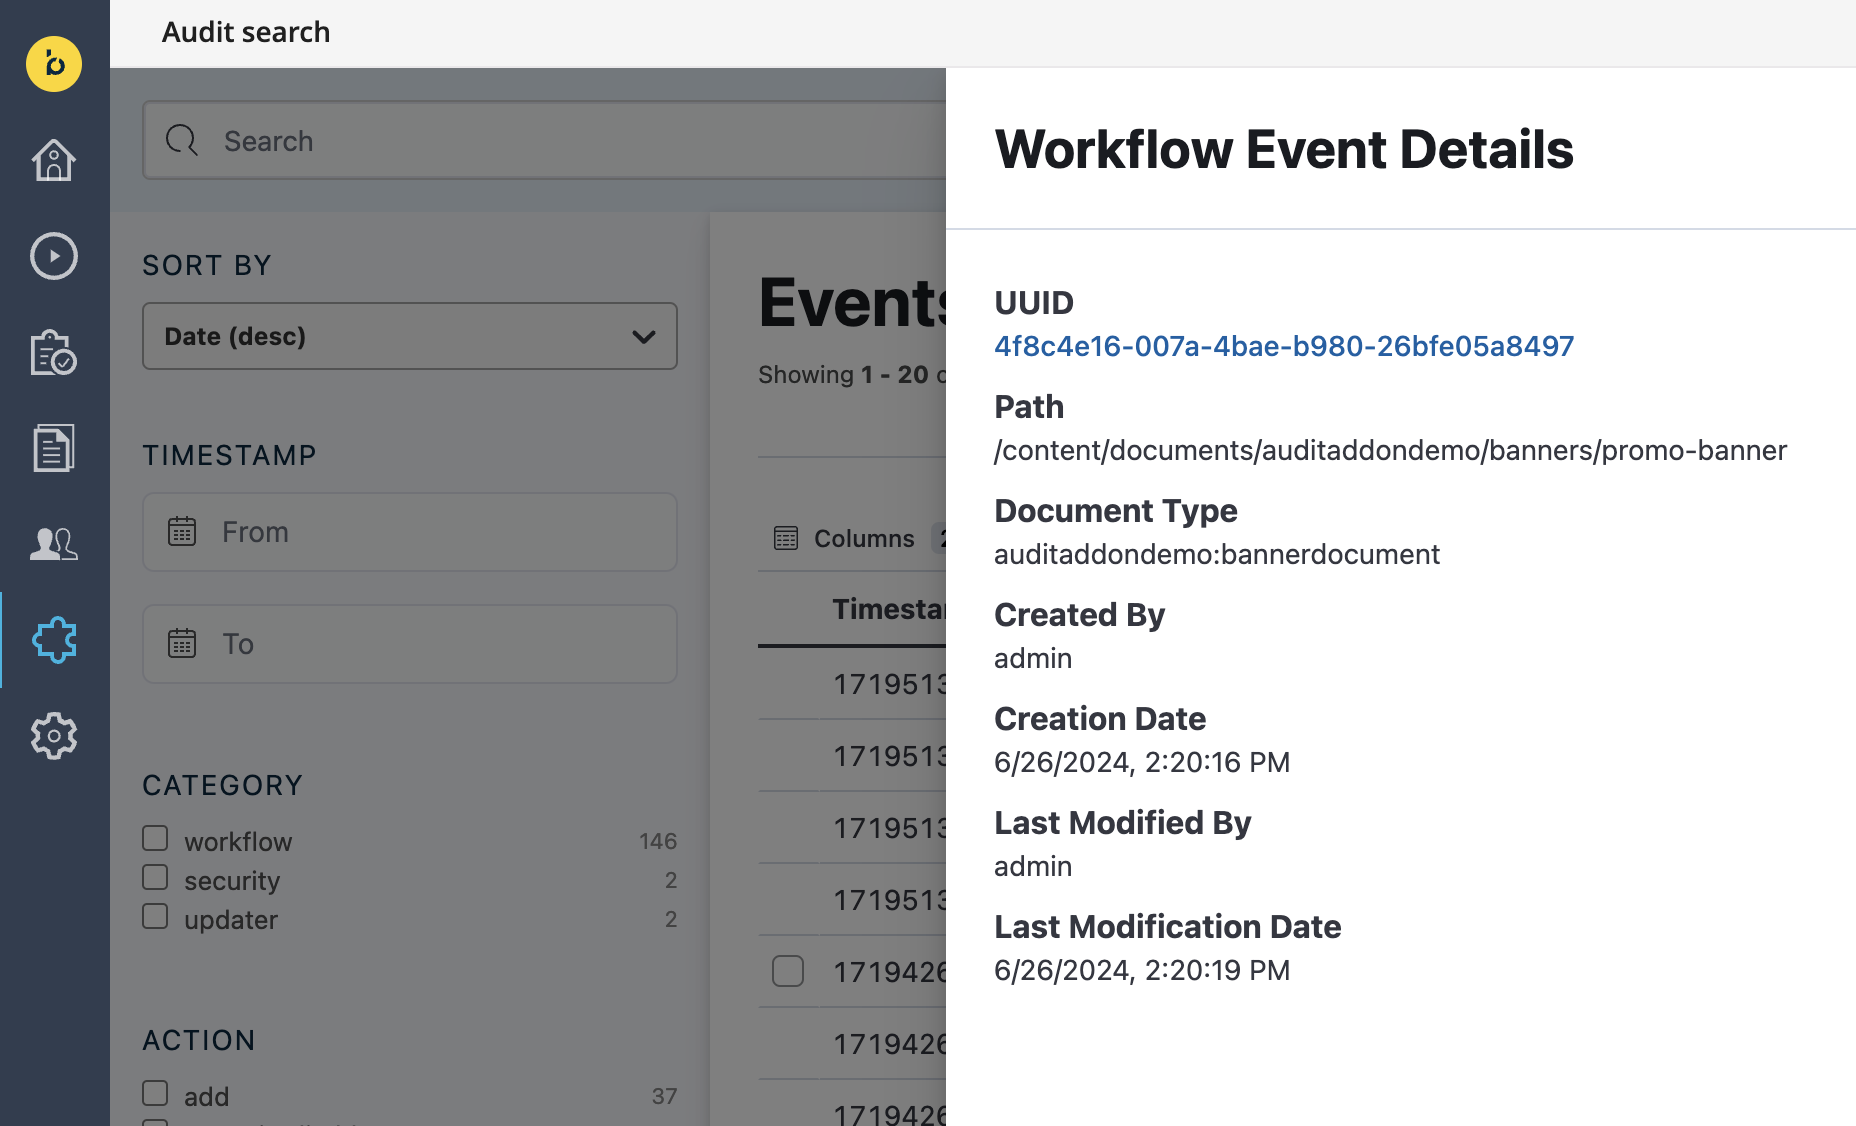
Some events include additional details not shown in the main results table. These events display an icon in the Details column.

To view the extra details:
- Click the icon in the Details column.
- A modal displays the event's additional information. For example, when a new banner document is created, the modal shows the document's UUID. Clicking the UUID hyperlink runs a text search for that UUID, displaying related events.